Abstract
This research investigated the effect of aggregate size on the bond strength of cast-in-place (CI) and post-installed (PI) reinforcement bars on 112 specimens (60 CI and 52 PI) under a pull-out test. The PI reinforcements were inserted to center of the concrete specimen using FIS EM plus 390 S epoxy mortar. Different coarse aggregate sizes (4.75 mm, 12.5 mm, 25 mm and 37.5 mm) were considered to study the influence of aggregate size. Reinforcement bars with diameters of 8 mm, 10 mm, and 12 mm were used. The experimental result showed that the influence of aggregate size on the bond strength of CI specimens with smaller bar diameters (8 mm and 12 mm) is insignificant. In the post-peak range, the residual bond of CI specimens with larger aggregate size is greater than that of CI samples with smaller aggregate size. All PI specimens failed in rebar rupture mode, regardless of the bar diameter, embedment length (even with a smaller embedment length of 5 times the diameter of the bar), aggregate size, and drilling technique. The epoxy mortar used was effective, enabling the utilization of 100% of the reinforcement bar capacity. Splitting failure mode was not observed in PI specimens, which is a good implication for the effectiveness of PI bars. In addition, comparisons between experimental and analytical models from codes and researchers were made, and it was found that the experimental results of the current study for CI specimens are in good agreement with the CEB-FIP 2010 model code predictions.
Keywords: Coarse Aggregate Size; Bond; Beam-Column Joint, Reinforcement Bar, Epoxy Mortar, Cast-In-Place; Post-Installed; Pull-Out; Splitting; Rupture.
Introduction
Bond is the term used to denote the interaction and transfer of force between reinforcement and concrete. Bond influences the performance of concrete structures in several ways. At the serviceability limit state, bond influences the width and spacing of transverse cracks, tension stiffening, and curvature. At the ultimate limit state, the bond is responsible for the strength of end anchorages and lapped joints of reinforcement, and influences the rotation capacity of plastic hinge regions [1]. The performance of reinforced concrete structures depends on adequate bond strength between concrete and reinforcing steel [2]. The bond strength between concrete and steel primarily arises from three different mechanisms: friction, adhesion and bearing (mechanical interlock) of ribs on the concrete [3].
Researchers have made a great effort over a century to identify factors affecting the bond strength between concrete and cast-in-place (CI) reinforcement bars. Recently, a comprehensive review of 170 articles on the factors affecting bond strength in concrete was carried out by Shunmuga Vembu, P.R., and Ammasi, A.K. (2023) [4]. The various factors that affect the bond strength in concrete as summarized by the researchers include; type of concrete (bond strength did not vary considerably regarding the type of concrete used), fibers (fibers play a vital role in developing bond strength), grade of concrete (the grade of concrete is linearly proportional to the bond strength), testing methods/standards, type of rebar, epoxy (using epoxy grouting, enhanced the bonding ability of concrete with the reinforced bars), size of rebar (diameter less than 16 mm deformed or ribbed steel bars created better bonding), corrosion, anchorage length (a bonding length of less than 5 times the diameter of the bar exhibits good bond behavior), confinement (lateral confinement improves the bond property by preventing splitting failure in concrete), concrete cover (the thicker the concrete cover distance, the higher the bond strength in concrete will be), temperature/fire (the temperature rise decreased the bond strength in concrete), aggregates type (the aggregate type has positive and negative effects on bond strength depending upon the physical properties and source of the aggregates) [4]. However, the factors influencing bond strength are not limited only to the above-listed items, especially for post-installed (PI) reinforcement bars.
The effect of maximum aggregate size on the bond strength of reinforced concrete was studied by S. Iqbal, N. Ullah, and A. Ali (2018) [5] experimentally their result shows that aggregate size is critical for bond strength when smaller size aggregates (less than 12.7mm) are used [5]. An experimental study by L. Asaye et al. (2025) [6] and the research outcome indicated that the bond strength is significantly influenced by the size of the coarse aggregate. There exists a notable difference in bond strength between concrete that incorporates larger coarse aggregate sizes and pure mortar, with a difference of approximately 38.65% [6]. The findings reported in [5] and [6] are particularly important for the capacity assessment of the beam-column joint (BCJ). In practice, BCJs are characterized by reinforcement congestion, which hinders coarse aggregate from flowing into the joint core. Hence, the aggregate size and volume in BCJs is likely to be less compared to the other regions. As a result, the expected bond strength at the design stage may not be achieved in BCJs in real structures. Despite the promising findings, less attention was given to aggregate size as a factor affecting bond strength between concrete and cast-in reinforcement bars in design codes and manuals.
With the increased demand for strengthening of reinforced structures, the utilization of post-installed reinforcing bars is becoming increasingly significant, as these bars are frequently employed in horizontal, vertical, and overhead applications for the rehabilitation and strengthening of existing structures [7]. The need to strengthen structures arises from multiple reasons, including poor design, design code updates driven by research advances, corrosion, aging of the structure, changes in the structure's intended purpose, and increased building height. For example, the need to strengthen BCJ (for shear) is inevitable for buildings designed and constructed under pre-seismic codes or before updated design codes. A less-invasive strengthening can be achieved by post-installing shear reinforcements into the joint core [8].
Unlike cast-in-place (CI) rebars embedded during concrete casting, PI rebars are installed after concrete has hardened, typically after years of service. The installation procedure involves drilling holes into the concrete member and fixing the bars using qualified mortar systems [9]. D. Darwin and S. S. Zavaregh (1996) [10] has studied factors affecting bond strength of PI rebars and their finding includes, hole preparation (has no significant effect), hole diameter (with the exception of bars anchored by capsule systems, the bond strength is not sensitive to hole diameter), bar size (directly proportional), embedment length (bond strength increases with increasing embedment length), cover (increasing cover increases bond performance), bar surface condition (bond strength is insensitive to epoxy-coated or uncoated surface), orientation of the installed bar (exhibit different bond strengths), and concrete strength (directly proportional to the bond strength) [10].
Extensive research has been done on factors affecting the bond strength of CI and PI reinforcement bars in concrete. However, studies specifically addressing the effect of aggregate size on the bond behavior of CI bars are limited, and for PI bars, this issue has not yet been investigated. Furthermore, the few available studies used only a narrow range of bar diameters (ŽĢ16 in [5], ŽĢ14 and ŽĢ16 in [6]), thereby restricting the applicability and generalizability of their findings.
To address the aforementioned gaps, this research conducted an experimental investigation to assess the effect of aggregate size on the bond strength of CI and PI reinforcement bars. Emphasis is given to reinforcement bar diameters of 8mm, 10mm and 12mm. These small bar sizes have not been addressed in previous studies on CI bars. Moreover, these diameters are commonly used for PI bars in structural strengthening applications. Various numerical models proposed by different researchers and building design manuals have also been studied to design experimental specimens. The results of this study will be compared against these existing analytical models and relevant building code provisions. Moreover, the findings will contribute to the development of effective strategies for using PI bars to strengthen BCJs (likely to be influenced by aggregate size and volume), which will form the focus of the authorsŌĆÖ future research.
Bond Strength Predictive Equations from Code Provisions and Analytical Modeling
Macroscopic Analysis
Several building codes and standards provide empirical or semi-empirical formulations for bond strength, primarily for CI reinforcement. PI anchorage systems are addressed separately through qualification standards. A summary is provided in Table 1.
Table 1 . Code based formulations for bond strength
| Code/ Standard | Main Approach | Key Parameters | Limitations |
|---|---|---|---|
| ACI 318-19 | Development length based on ŌłÜfŌĆÖc $$\tau = \frac{f_{y}{\ A}_{b}}{\pi{\ d}_{b}{\ l}_{d}}$$ $$l_{d} = \left( \frac{f_{y}{\ \psi}_{t}\psi_{e\ }\psi_{s}^{\ \ \lambda}}{2.1\sqrt{f_{c}^{\ \ '}}} \right)d_{b}$$ |
Where, fy is the yield strength of rebar Ø£ōØæĪ is the location factor, Ø£ōØæÆ is the coating factor, Ø£ōØæĀ is the reinforcement size factor, ╬╗ is the type of concrete, ØæōcŌĆÖ is the concreteŌĆÖs compressive strength in MPa, ØææØæÅ is the bar diameter in mm | Its applicability is for CI. No PI or aggregate size consideration |
| Canadian Standards Association (CSA) Error! Reference source not found. | The CSA code has the same equation as the ACI to estimate the development length of reinforcement rebar. The key variation between the ACI and CSA codes is the rebar diameter factor. According to the ACI, the rebar diameter factor is decreased from 1.0 to 0.8 if the bar diameter is equal to or less than 6 mm; in the CSA code, the rebar diameter factor is decreased from 1.0 to 0.8 if the rebar is equal to or less than 20 mm in diameter [6]. | ||
| Australian Standard 3600 [12] | $$\tau_{u} = 2.5\sqrt{{f_{c}}^{'}\ \left( \frac{c}{d_{b}} + 0.5 \right)}$$ | Where, Žäu is the maximum value of bond strength in MPa, fc' is the compressive strength of concrete in MPa, c is the radius of a cylinder concrete specimen in mm, and ØææØæÅ is the bar diameter in mm. | Its applicability is for CI. |
| New Zealand Concrete Standards (NZS 3101:2006) [13] | $$\tau = \frac{f_{y}{\ A}_{b}}{\pi{\ d}_{b}{\ l}_{d}}$$ $$l_{d} = \frac{{\alpha_{a}\ \alpha}_{b}}{\alpha_{c\ }\alpha_{d}}0.5\frac{f_{y\ }d_{b}}{\sqrt{{fc}_{\ }^{'}}}\ \geq 300mm$$ $$\alpha_{d} = 1 + \sqrt{\left( \frac{A_{tr}}{s} \right)\left( \frac{f_{yt}}{80nd_{b}} \right)}$$ 1.0 Ōēż ╬▒d Ōēż 1.5. ndb |
Where, ╬▒a = 1.3 for top reinforcement where more than 300 mm of fresh concrete is cast in the member below the bar, or 1.0 for all other cases, ╬▒b = Asr/Asp, Asr, is required flexural reinforcement, Asp is provided flexural reinforcement, ╬▒c = 1 Ōēż 1+0.5(cm/db-1.5) Ōēż 1, cm = the lesser of the concrete cover or the clear distance between bars, the value of fc┬┤ shall not exceed 70 MPa, | Its applicability is for CI. |
| fib Model Code 2010 [1] | ŌłÜf_cm-based bond stress model $$\tau_{u} = 2.5\sqrt{f_{cm}}$$ |
Where, Ļ×ću is the maximum value of bond strength in MPa, fcm is the mean value of compressive strength of concrete in MPa. | Its applicability is for CI. No PI provisions |
| Japan Society of Civil Engineers (JSCE) [14] | fbokŌĆä=ŌĆä0.28fck┬Ā┬ĀŌĆ▓ŌĆäŌēżŌĆä4.2┬ĀMPa | Where, fbok is the bond strength of deformed bars and fckŌĆÖ is the characteristic compressive strength of concrete. | Its applicability is for CI. |
| Indian Standard (IS 456: 2000) [15] |  |
According to IS 456: 2000, the bond strength of reinforcement bars is given as a function of concrete grade. | Its applicability is for CI. |
| Eurocode 2 , ESEN 1992 [16], [17] | Bond stress based on tensile strength fbd┬Ā=┬Ā2.25┬Ā╬Ę1┬Ā╬Ę2┬Āfctd |
Where, fctd is the design value of concrete tensile strength, ╬Ę1 = 1.0 when ŌĆśgoodŌĆÖ conditions are obtained, ╬Ę1 = 0.7 for all other cases and for bars in structural elements built with slip-forms, unless it can be shown that ŌĆśgoodŌĆÖ bond conditions exist, ╬Ę2 = 1.0 for Žå Ōēż 32 mm, ╬Ę2 = (132 - Žå)/100 for Žå > 32 mm. | Its applicability is for CI. No PI anchorage |
| ACI 355.2 19 | Pull-out resistance for adhesive anchors | Adhesive type, embedment, hole geometry | It's applicable for PI. Not for CI bars |
| EOTA TR 023 | Adhesive anchor qualification $$\tau_{Rk} = \frac{N_{Rk}}{\pi dl_{ef}}$$ |
Adhesive class, embedment | Its applicability is for PI. No CI application |
Analytical Bond Strength Models
Numerous analytical models have been developed to predict bond behavior. These models capture mechanisms such as bondŌĆōslip response, and adhesive anchorage behavior as indicated in Table 2.
Table 2 . Analytical models for the prediction of bond behavior
| Researcher/ Model | Formulation | Key Variables | Limitations |
|---|---|---|---|
| Orangun, Jirsa & Breen (1977) | Empirical CI bond model $$\tau_{\max} = \frac{f_{y}{\ d}_{b}}{4{\ l}_{d}}$$ $$\frac{l_{d}}{d_{b}} = 0.04\frac{f_{y}}{\sqrt{{f'}_{c}}}\left( \frac{K_{tr}}{d_{b}} + 1 \right)$$ |
ld ŌĆō development length; db ŌĆō bar diameter; fy ŌĆō yiled strength of bar; fcŌĆÖ ŌĆō concrete compressive strength; Ktr = transverse reinforcement index | Its applicability is for CI. |
| Shima, et al. (1987) | For long embedment length; $$\tau = \frac{0.73\ f_{c}^{\ '}{(\ln(1 + 5s))}^{3}}{1 + \varepsilon*10^{5}}$$ For short embedment length; ŽäŌĆä=ŌĆä0.9fcŌĆ▓┬Ā2/3(1ŌĆģŌłÆŌĆģeŌłÆ40s0.6) |
Where, Ļ×ć is bond stress in MPa, s = 1000S/D, S is slip, D is diameter of bar, fcŌĆÖ is concrete compressive strength in MPa, ╬Ą is strain. Where, Ļ×ć is bond stress in MPa, s = S/D, S is slip, D is diameter of bar, fcŌĆÖ is concrete compressive strength in MPa. |
Its applicability is for CI. |
| J. Zuo and D. Darwin (2000) [21] | BondŌĆōslip law $$\tau = \frac{f_{y}{\ A}_{b}}{\pi{\ d}_{b}{\ l}_{d}}$$ $$l_{d} = \ \frac{\frac{A_{b}f_{s}}{{{f_{c}^{\ }}^{'}}^{1/4}(0.1\frac{c_{\max}}{c_{\min}} + 0.90)} - 56.2A_{b}}{1.43(c_{\min} + 0.5d_{b})}$$ |
Where, ld is splice or development length in mm, fcŌĆÖ is concrete compressive strength in MPa, fs is stress at failure in MPa, db is bar diameter in mm, cmin, cmax = minimum or maximum value of cs, or cb (cmax/cmin < 3.5) in mm, cs = min (csi + 0.25, cso), csi is 1/2 of clear spacing between bars in mm, cso, cb = side or bottom cover of reinforcing bars in mm, db is bar diameter in mm. | Its applicability is for CI. |
| M. R. Esfahani and B. Rangan [22] | $$\tau_{u} = 8.6\ \frac{\frac{c}{d} + 05}{\frac{c}{d} + 5.5}f_{ct}$$ | Where, Ļ×ću is the maximum value of bond strength in MPa, fct is the tensile strength of concrete taken as 0.55fcŌĆÖ in MPa, fcŌĆÖ is the compressive strength of the concrete in MPa, c is the minimum concrete cover in mm, and d is the diameter of the bar in mm. | Its applicability is for CI. |
| C. O. Orangun, et al. (1975) [23] | $$\tau_{u} = 0.083045\sqrt{f_{c}^{\ '}}\left\lbrack 1.2 + 3\frac{c}{d_{b}} + 50\frac{d_{b}}{l_{d}} \right\rbrack$$ $$l_{d} = \ \frac{\frac{A_{b}f_{s}}{{{f_{c}^{\ }}^{'}}^{1/2}} - 16.6A_{b}}{\pi\left( {(0.25(c}_{\min} + 0.4d_{b} \right) + (\frac{A_{tr}}{41.5sn}f_{yt}))}$$ |
Where, ld is splice or development length in mm, fcŌĆÖ is concrete compressive strength in MPa, fs is stress at failure in MPa, cmin, = minimum concrete cover or 1/2 of clear spacing between bars in mm, db is bar diameter in mm, Atr is area of transverse reinforcement, fyt is yield strength of transverse reinforcement, s is spacing of transverse reinforcement in mm, n is number of bars developed or spliced at the same location. | Its applicability is for CI. |
| Darwin et al. (1992) [24] | $$\tau_{u} = 0.083045\sqrt{f_{c}^{\ '}}\ \left\lbrack 2.12\left( \frac{c}{d_{b}} + 0.5 \right)\left( 0.92 + 0.08\frac{c_{\max}}{c_{\min}} \right) + 75\frac{d_{b}}{l_{d}} \right\rbrack$$ $$l_{d} = \ \frac{\frac{A_{b}f_{s}}{{{f_{c}^{\ }}^{'}}^{1/4}(0.1\frac{c_{\max}}{c_{\min}} + 0.90)} - 51A_{b}}{1.5(c_{\min} + 0.5d_{b})}$$ |
Where, ld is splice or development length in mm, fcŌĆÖ is concrete compressive strength in MPa, fs is stress at failure in MPa, db is bar diameter in mm, cmin, cmax = minimum or maximum value of cs, or cb (cmax/cmin < 3.5) in mm, cs = min (csi + 0.25, cso), csi is 1/2 of clear spacing between bars in mm, cso, cb = side or bottom cover of reinforcing bars in mm, db is bar diameter in mm. | Its applicability is for CI. |
Materials and Methods
Materials
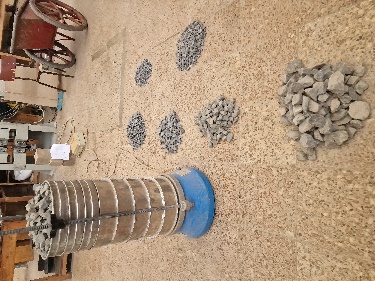
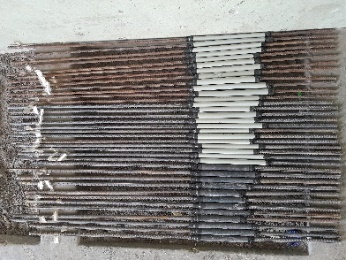
The materials used in this study include coarse aggregate, fine aggregate, water, cement, reinforcement bar, and bonding agent (epoxy resin). Basaltic rock crushed rock was selected as a coarse aggregate. The coarse aggregates were sieved according to ASTM C 136-06 [25] using standard sieve sizes as shown in Fig. 1. The sieved aggregates were used to get the required gradation. From ASTM C33, four different coarse aggregate sizes were chosen: ii) No. 9, mortar (4.75 to 1.18 mm), ii) No. 7 (12.5 to 4.75 mm), iii) No. 5 (25 to 12.5 mm), and iv) No. 4(37.5 to 19 mm). For each aggregate size class, grading limits were verified to ensure compliance with ASTM C33 requirements [26].
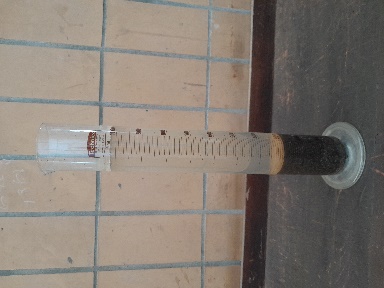
Natural river sand with a particle size passing the 4.75mm sieve and retained on the 75-╬╝m sieve was used [27]. The sand was washed and sun-fried (see Fig. 2) to remove the excess silt. Subsequently, the silt content was checked (see Fig. 3) and found to be 0.26%. Dangote Portland Pozzolana Cement (CEM-II 32.5 R) was used to prepare the concrete mixtures. Clean, impurity-free tap water from the municipal supply was used as mixing water, and no chemical admixtures were added.

Three different deformed reinforcement bar sizes (diameters 8mm, 10mm, and 12mm) were used in this study. To determine the mechanical properties of the reinforcement bars, a tensile strength test was carried out, as shown in Fig. 4. The mechanical properties of reinforcement bars obtained from the uniaxial tensile strength test are shown in Table 3.
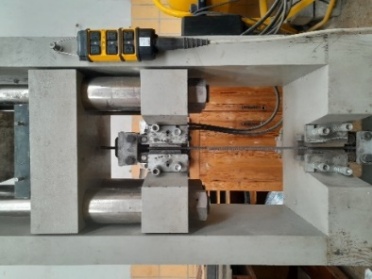
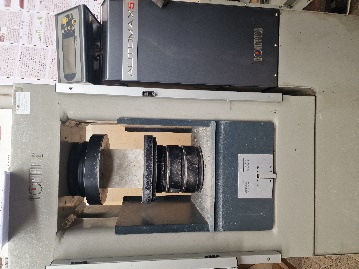
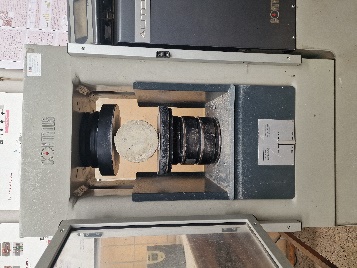
Fig. 4 . Material strength testing; a) Uni-axial tensile strength of reinforcement bar, b) Concrete compressive strength test, c) Concrete splitting tensile strength test
Table 3 . Analytical models for the prediction of bond behavior
| Rebar Specimen No. | Diameter | Assumed Modulus of Elasticity | Yield Load | Failure Load | Yield strength | Ultimate strength | Yield Strain | Ultimate strain | |
|---|---|---|---|---|---|---|---|---|---|
| ┬Ā | d1, (mm) | d2, (mm) | (GPa) | (kN) | (kN) | (MPa) | (MPa) | ╬Ąe (%) | ╬Ąu (%) |
| ŽĢ8-1 | 7.47 | 8.6 | 200 | 28.4 | 32.1 | 565.00 | 638.60 | 0.28 | 15 |
| ŽĢ8-2 | 7.55 | 8.62 | 200 | 28.9 | 32.3 | 574.95 | 642.59 | 0.2815 | 17.5 |
| ŽĢ8-3 | 7.48 | 8.62 | 200 | 25.8 | 28.2 | 513.27 | 561.02 | 0.2535 | 25 |
| Average | 551.07 | 614.07 | 0.27 | 19.17 | |||||
| ŽĢ10-1 | 9.34 | 10.65 | 200 | 42.6 | 50.6 | 542.40 | 644.26 | 0.2715 | 16 |
| ŽĢ10-2 | 9.52 | 10.7 | 200 | 42.7 | 51.2 | 543.67 | 651.89 | 0.266 | 20 |
| ŽĢ10-3 | 9.45 | 10.58 | 200 | 42.2 | 51.1 | 537.3.7 | 650.63 | 0.2678 | 18 |
| Average | 541.13 | 648.93 | 0.2684 | 18 | |||||
| ŽĢ12-1 | 11.47 | 12.74 | 200 | 68.4 | 78.7 | 604.79 | 695.86 | 0.2972 | 26.6667 |
| ŽĢ12-2 | 11.55 | 12.74 | 200 | 69.9 | 78.5 | 618.05 | 694.09 | 0.3017 | 28.3333 |
| ŽĢ12-3 | 11.33 | 12.76 | 200 | 69.3 | 77.9 | 612.75 | 688.79 | 0.3041 | 25 |
| Average | ┬Ā | ┬Ā | ┬Ā | ┬Ā | ┬Ā | 611.86 | 692.91 | 0.301 | 26.6667 |
Bonding agent (Epoxy): - For anchoring the PI reinforcement bars, Fischer Injection mortar FIS EM plus 390 S has been used.
Methods
Specimen description
To investigate the effect of aggregate size on the bond strength of CI or PI reinforcement bars through the pull-out test, a total of 112 specimens (with 60 CI and 52 PI reinforcement bars) were produced. According to 26.4.2.1 (a) (5) of ACI 318-19, maximum size of coarse aggregate shall not exceed the least of (i) one-fifth the narrowest dimension between sides of forms, (ii) one-third the depth of slabs, (iii) three-fourths the minimum specified clear spacing between individual reinforcing bars or wires, bundles of bars, pre-stressed reinforcement, individual tendons, bundled tendons, or ducts [28]. Accordingly, a cylindrical mold size of 150 mm diameter and 300 mm height was used for 88 of the specimens fabricated with maximum coarse aggregate sizes of 25 mm, 12.5 mm, and 4.75 mm. For the remaining 24 specimens with a maximum coarse aggregate size of 37.5 mm, a different cylindrical mold, having a 200 mm diameter and 250 mm height, was used.
For concrete compressive strength, a total of 15 cubes (3 from each test series) of size 150 mm x 150 mm x 150 mm were taken and tested (refer to Fig. 4). Similarly, the splitting tensile strength test (see Fig. 5) was carried out on 12 cylinders of size 100 mm x 200mm (3 from each test series with coarse aggregate size of other than 37.5 mm) and 3 cylinders of size 150 mm x 300mm for a test series with maximum coarse aggregate size of 37.5 mm.
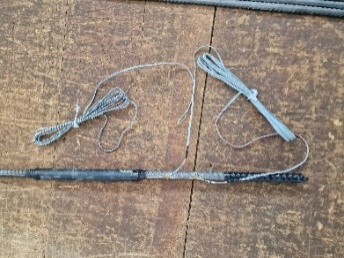
To maintain the unbonded length of the reinforcement bars, a plastic sleeve was used and sealed with tape to prevent the flow of mortar between the plastic sleeve and the reinforcement, as shown in Fig. 6. Two strain gauges were installed on each of two 12 mm bars to check the strain distribution of CI and PI reinforcement bars, see Fig. 7.
Embedment length of the specimens was determined according to the CEB-FIB (2010) model code [1] and the failure mode was predicted. To verify the prediction, out of the total 112 specimens, 36 (18 CI and 18 PI) specimens with a maximum aggregate size of 25 mm were fabricated (see Table 4 for detail) and tested through a pull-out testing method (refer Fig. 7). Having seen the results of the 36 (18 CI and 18 PI) specimens, the remaining 76 specimensŌĆÖ detail (mainly the embedment length) was revised.
Specimen notation
Notation of the specimens was made based on the coarse aggregate sizes (4.75 mm 12.5mm, 25 mm and 37.5 mm were designated by A, B, C&CN and D respectively), diameter of the reinforcement bars used (represented by 8, 10 and 12 for 8 mm, 10 mm and 12 mm bars respectively), embedment length (L followed by the amount of embedment length) and the method of reinforcement bars installation (Cast-in-place (CI) or Post-installed (PI)). For example, a specimen made of concrete with a maximum coarse aggregate size of 25 mm (C), a reinforcement bar of 12 mm (12) diameter, an embedment length (L) of 120mm, and a cast-in-place (CI) reinforcement is designated as C12L120CI. Exclusively, for test series C, there are some samples designated by CN, which means new (revised) specimens of the C series. This is because test series C was conducted in two phases as discussed above. Additionally, a reinforcement bar with a diameter of 10 mm was considered only for C series specimens. Details of the samples investigated in this study are shown in Table 4.
Table 4 . Details of specimens
| Test Series | Specimen Name | Coarse aggregate size, (mm) | Rebar diameter, (mm) | Embedment length, (mm) | Clear cover, (mm) | No of specimens | Rebar installation method |
|---|---|---|---|---|---|---|---|
| A | A8L70CI | 4.75 | 8 | 70 | 71 | 2 | Cast-in-place |
| A8L90CI | 4.75 | 8 | 90 | 71 | 2 | ||
| A8L110CI | 4.75 | 8 | 110 | 71 | 2 | ||
| A12L120CI | 4.75 | 12 | 120 | 69 | 2 | ||
| A12L140CI | 4.75 | 12 | 140 | 69 | 2 | ||
| A12L160CI | 4.75 | 12 | 160 | 69 | 2 | ||
| A8L40PI | 4.75 | 8 | 40 | 71 | 2 | Post-installed | |
| A8L70PI | 4.75 | 8 | 70 | 71 | 2 | ||
| A12L60PI | 4.75 | 12 | 60 | 69 | 2 | ||
| A12L120PI | 4.75 | 12 | 120 | 69 | 2 | ||
| B | B8L70CI | 12.5 | 8 | 70 | 71 | 2 | Cast-in-place |
| B8L90CI | 12.5 | 8 | 90 | 71 | 2 | ||
| B8L110CI | 12.5 | 8 | 110 | 71 | 2 | ||
| B12L120CI | 12.5 | 12 | 120 | 69 | 2 | ||
| B12L140CI | 12.5 | 12 | 140 | 69 | 2 | ||
| B12L160CI | 12.5 | 12 | 160 | 69 | 2 | ||
| B8L40PI | 12.5 | 8 | 40 | 71 | 2 | Post-installed | |
| B8L70PI | 12.5 | 8 | 70 | 71 | 2 | ||
| B12L60PI | 12.5 | 12 | 60 | 69 | 2 | ||
| B12L120PI | 12.5 | 12 | 120 | 69 | 2 | ||
| C | C8L70CI | 25 | 8 | 70 | 71 | 2 | Cast-in-place |
| C8L90CI | 25 | 8 | 90 | 71 | 2 | ||
| C8L110CI | 25 | 8 | 110 | 71 | 2 | ||
| C10L90CI | 25 | 10 | 90 | 70 | 2 | ||
| C10L110CI | 25 | 10 | 110 | 70 | 2 | ||
| C10L130CI | 25 | 10 | 130 | 70 | 2 | ||
| C12L120CI | 25 | 12 | 120 | 69 | 2 | ||
| C12L140CI | 25 | 12 | 140 | 69 | 2 | ||
| C12L160CI | 25 | 12 | 160 | 69 | 2 | ||
| C8L70PI | 25 | 8 | 70 | 71 | 2 | Post-installed | |
| C8L90PI | 25 | 8 | 90 | 71 | 2 | ||
| C8L110PI | 25 | 8 | 110 | 71 | 2 | ||
| C10L90PI | 25 | 10 | 90 | 70 | 2 | ||
| C10L110PI | 25 | 10 | 110 | 70 | 2 | ||
| C10L130PI | 25 | 10 | 130 | 70 | 2 | ||
| C12L120PI | 25 | 12 | 120 | 69 | 2 | ||
| C12L140PI | 25 | 12 | 140 | 69 | 2 | ||
| C12L160PI | 25 | 12 | 160 | 69 | 2 | ||
| CN | CN12L120CI | 25 | 12 | 120 | 69 | 2 | Cast-in-place |
| CN12L140CI | 25 | 12 | 140 | 69 | 2 | ||
| CN12L160CI | 25 | 12 | 160 | 69 | 2 | ||
| CN8L40PI | 25 | 8 | 40 | 71 | 2 | Post-installed | |
| CN10L50PI | 25 | 10 | 50 | 70 | 2 | ||
| CN12L60PI | 25 | 12 | 60 | 69 | 2 | ||
| D | D8L70CI | 37.5 | 8 | 70 | 96 | 2 | Cast-in place |
| D8L90CI | 37.5 | 8 | 90 | 96 | 2 | ||
| D8L110CI | 37.5 | 8 | 110 | 96 | 2 | ||
| D12L120CI | 37.5 | 12 | 120 | 94 | 2 | ||
| D12L140CI | 37.5 | 12 | 140 | 94 | 2 | ||
| D12L160CI | 37.5 | 12 | 160 | 94 | 2 | ||
| D8L40PI | 37.5 | 8 | 40 | 96 | 2 | Post-installed | |
| D8L70PI | 37.5 | 8 | 70 | 96 | 2 | ||
| D12L60PI | 37.5 | 12 | 60 | 94 | 2 | ||
| D12L120PI | 37.5 | 12 | 120 | 94 | 4 | ||
| D12L120PDPI* | 37.5 | 12 | 120 | 94 | 2 |
* Specimens without pre-installed plastic sleeve and post- drilled on hardened concrete.
Concrete mixing, casting and curing
The target compressive strength of concrete was 25 MPa. To achieve the target compressive strength, the mix design of the concrete was carried out according to ACI 211.1-91 [29]. The amount of ingredients used in this research is shown in Table 5.
Before mixing the concrete constituents, the molds were cleaned and oil-painted, and the reinforcements (for the CI specimens) and plastic conduits (for the PI specimens) were placed at the center of the molds. Plastic conduit was used for PI specimens and removed after 24 hours to minimize drilling time and effort. In a real scenario, hardened concrete is drilled to place the PI bars. Drilling hardened concrete might cause a defect in the concrete. To investigate the effect of post-drilling, 4 specimens (2 of which were drilled after the concrete was hardened and a plastic sleeve was used in the remaining 2 specimens) were tested.
Table 5. Amount of ingredients for concrete mix
| Test series | Coarse aggregate, (kg) | Sand, (kg) | PPC Cement, (kg) | Water, (kg) |
|---|---|---|---|---|
| A | 96.95 | 304.96 | 97.03 | 55.6 |
| B | 219.58 | 161.73 | 88.52 | 50.79 |
| C | 355.48 | 261.82 | 103.50 | 59.39 |
| CN | 198.13 | 145.93 | 27.12 | 16.56 |
| D | 343.05 | 252.67 | 73.09 | 41.935 |
The concrete ingredients were dry-blended using a rotary mixer. Then water was added, and the mix was continued until all ingredients were well blended and formed a fresh, workable concrete. The concrete was poured into the cylindrical molds and vibrated. After 24 hours, the specimens were demolded and cured in a water pond for a week. Blending and curing of the concrete were managed according to ASTM C192 [30]. All necessary steps are shown in Fig. 7.
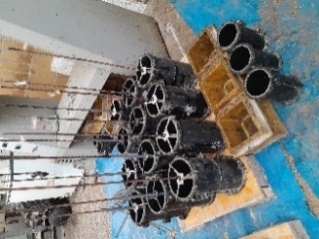
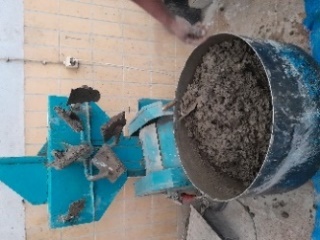
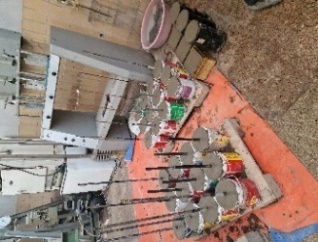
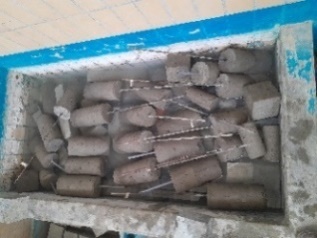
Fig. 7. Concrete mixing, casting and curing procedures; a) oil painted moulds, b) well mixed fresh concrete, c) Samples, d) curing
Drilling, cleaning, ejecting epoxy mortar and inserting the PI bars
After one week of curing, the concrete samples were kept in the open air for 28 days before drilling. Holes were drilled in the PI concrete specimens using a rotary hammer drill. The holes were drilled using 12 mm, 14 mm, and 18 mm diamond bits along the longitudinal axes of the PI concrete specimens for installation of 8 mm, 10 mm, and 12 mm diameter reinforcement bars, respectively [31]. The drilled holes were brushed with a wire brush to form a rough surface, which enhances the bond between hardened concrete and epoxy mortar. To remove dust particles from the drilled and brushed holes, compressed air was used [31]. Drilling and cleaning procedures are shown in Fig. 8.
A well-mixed (grey) epoxy mortar was dispensed into two-thirds of the drilled and cleaned holes from the bottom, and the reinforcement bar was installed by twisting. Any extra epoxy mortar after installation of the reinforcement bar was cleaned. According to the manufacturerŌĆÖs instruction manual, the curing time of PI specimens (in dry concrete) under a system temperature between 20 ┬░C and 29 ┬░C is 10 hours. The procedures followed are shown in Fig. 9. More details on how to inject the epoxy mortar used in this research can be found in the manufacturerŌĆÖs instruction manual. The instruction manual is available on https://manuals.plus/fischer/fis-em-plus-injection-mortar-manual.
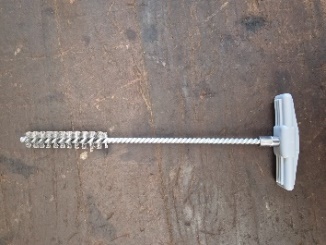
Fig. 8. Drilling and cleaning procedures; a) wire brush, b) brushing the drilled holes
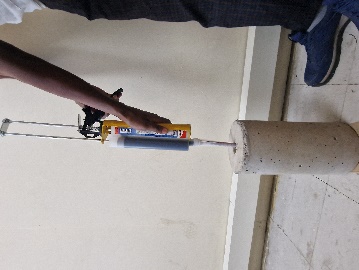
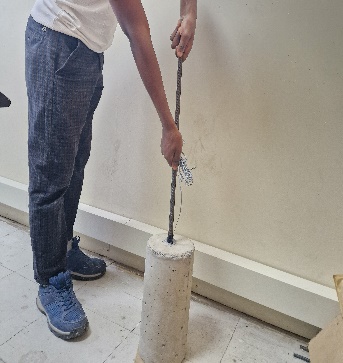
Fig. 9. Post installation process; a) injecting epoxy into the hole, b) inserting the rebar by twisting
Test Setup
Instrumentation was primarily established to measure the bond stress-slip of the test specimens. The reinforcing bar was inserted through the center-hole jack and secured by the upper jaws of the testing apparatus. A center hole-jack testing machine, with a capacity of 300 kN, was utilized to apply the load, while continuous monitoring of the applied load was facilitated by a center hole load cell, as illustrated in Fig. 10. During the experimental procedure, transducers were employed to assess the free-end slip of the bar. The strain gauges and transducers were linked to a data logger, and the experimental data were documented via video (as a backup), with the results subsequently retrieved using a USB flash drive [6].
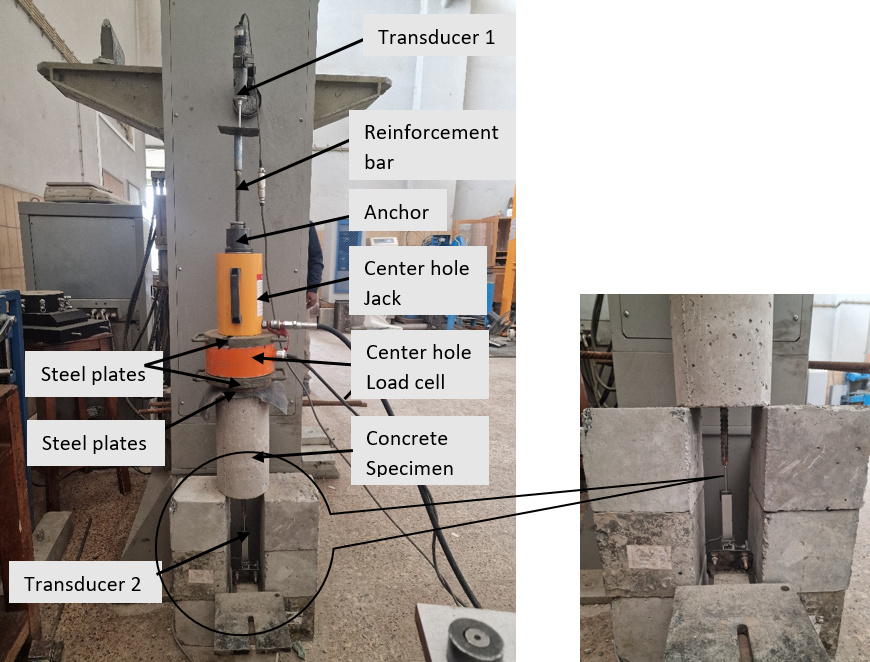
Fig. 10. Test setup for pull-out
Results and Discussion
Compressive and tensile strength of concrete
On the 28th day, the concrete compressive strength for all samples was 25 MPa. However, the test results show non-uniformity in the compressive and tensile strengths of the concrete samples from each series (see Table 6). The influence of concrete compressive strength on bond capacity is a function of (fc') 1/2 [2][11][12][13][23][24]. To elude the effect of concrete grade on the bond strength of the specimens, the bond strength of each specimen was normalized by (fc')1/2.
Table 6. Concrete Properties
| Test Series | Maximum coarse aggregate size, mm |
Compressive Strength, MPa |
Splitting Tensile Strength, MPa |
|---|---|---|---|
| A | 4.75 | 13.72 | 1.26 |
| B | 12.5 | 20.76 | 1.19 |
| C | 25 | 18.85 | 1.45 |
| CN | 25 | 19.36 | 1.23 |
| D | 37.5 | 26.08 | 1.59 |
Failure mode and bond strength
The bond stress is assumed to be uniformly distributed (average) along the embedment length and calculated according to equation (1) [32].
Where, Ļ×ć is the average maximum value of bond strength in MPa, Pmax is the maximum pull-out force in kN, Ab is the area of rebar in mm, db is the diameter of rebar in mm, and ld is the embedment length in mm.
A summary of the experimental results of 112 specimens is shown in Table 7 to Table 10 for test series A, B, C, and D, respectively. Failure modes of the experimental results include: splitting (4 specimens), pull-out after reinforcement bar yielded (22 specimens), and rebar rupture (96 specimens). All failure modes were exhibited after the yielding of the reinforcement bar. The results show there is almost a perfect bond between the concrete and the PI bars. This is mainly because the epoxy mortar used in the study was effective, enabling the full utilization of the reinforcement capacity. Fig. 11 depicts a sample taken from a specimen that failed by rebar rupture mode, which illustrates strong adhesion between the epoxy mortar and the reinforcement bar. 100% of the PI specimens failed in rebar rupture mode, regardless of the bar diameter, embedment length (even with a smaller embedment length than the CI sample), aggregate size, and drilling technique. However, from a structural point of view preferred mode of failure (ductile mode) is pull-out failure after the rebar has yielded.
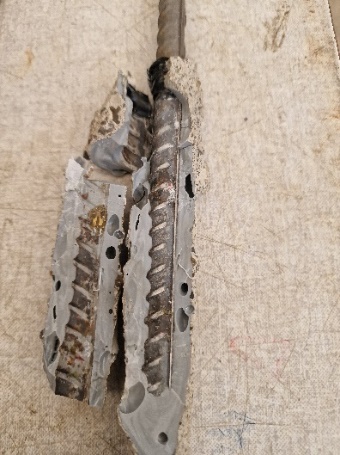
Fig. 11. Adhesion bond between epoxy mortar and PI rebar
The pull-out test results of the A-series
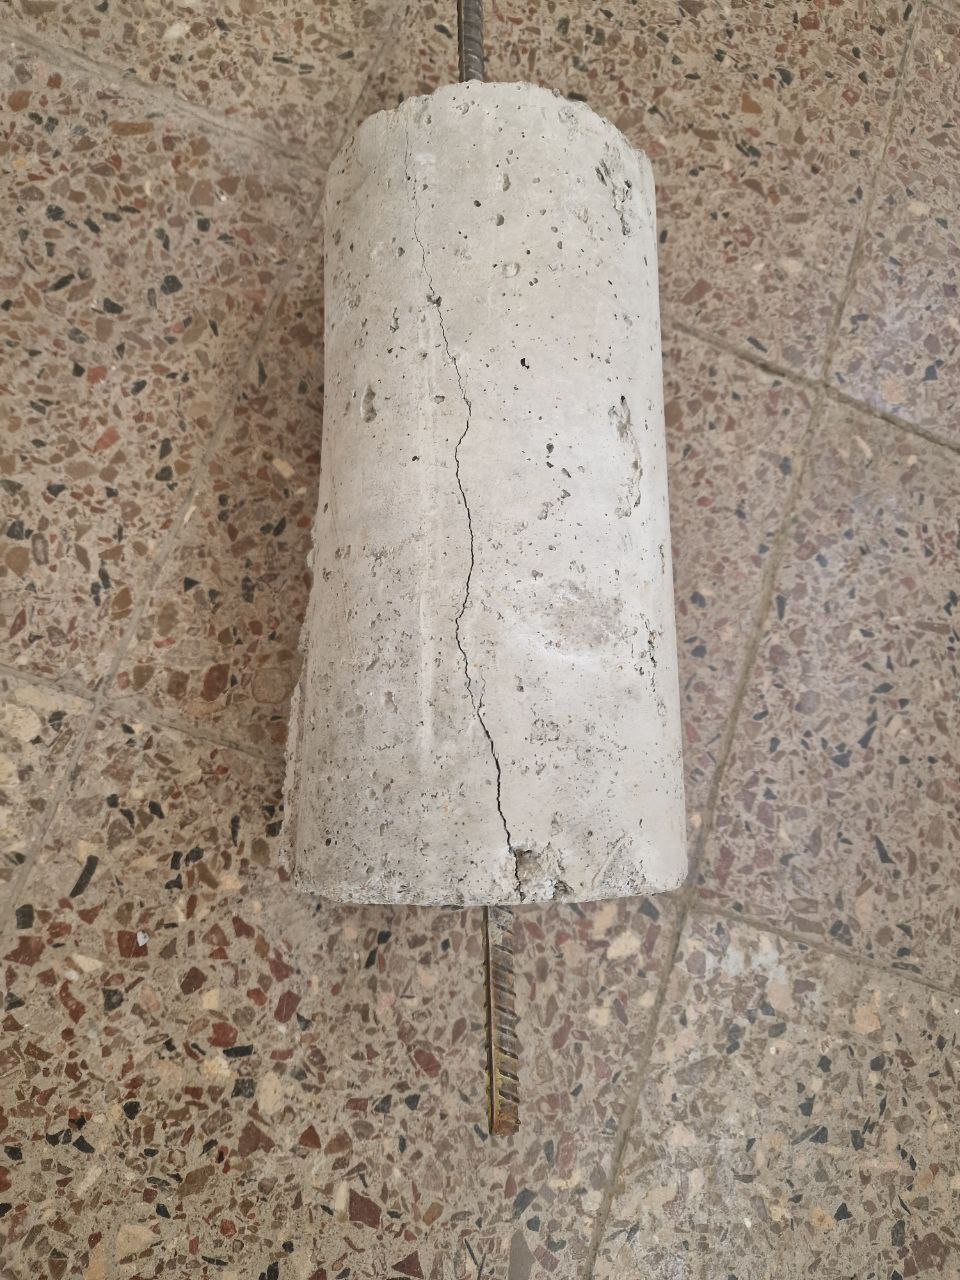
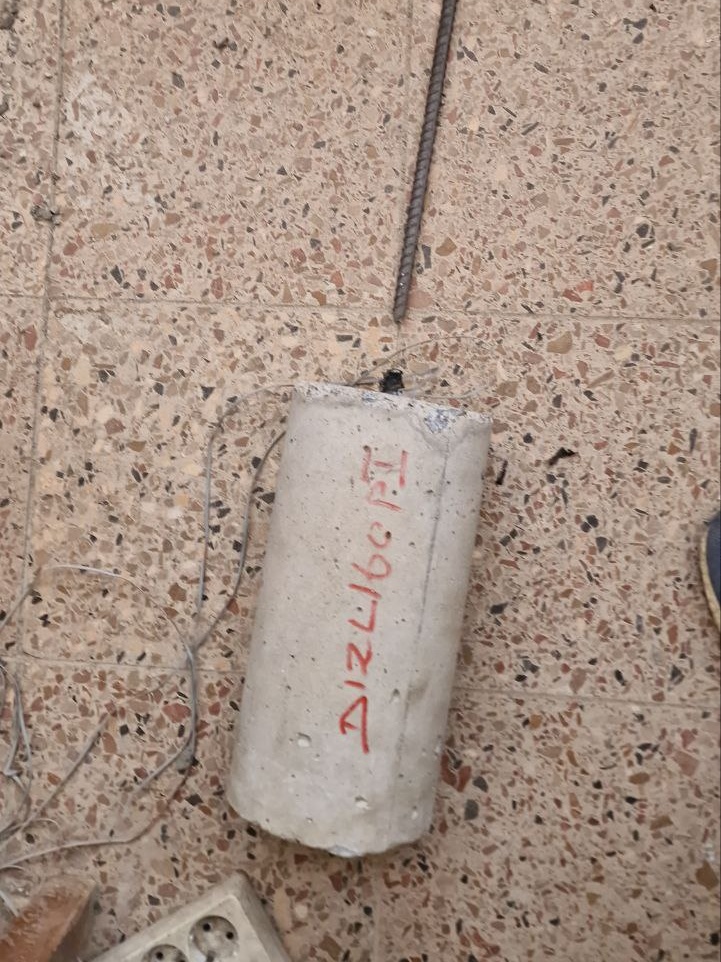
Table 7 shows a summary of the test results of series A. Four CI specimens of test series A with a rebar diameter of 12mm failed by splitting of the concrete, which is not the case in other test series. Except for one CI specimen (failed by pull-out), the remaining samples (CI or PI) failed by rebar rupture mode. Fig. 12 shows the bond-slip relationship for the rupture mode of failure and comparison between CI and PI specimens. Even if both CI and PI specimens of the same bar diameter and embedment length failed by the same mode of failure (rebar rupture), slip is the major difference. For a bar diameter of 8mm, the CI bar specimen demonstrates nearly three times higher slip than that of the PI bars at an embedment depth of 70mm. Interestingly, the A12L120CI specimen finally failed in splitting mode, whereas the corresponding A12L120PI failed in rebar rupture, see Fig. 13. This clearly demonstrates that the PI bars are less prone to splitting than the CI bars.
Table 7. The pull-out test results of the A-series
| Test Series | Specimen Name | Specimen No. | Maximum Load, (kN) | Maximum Bond Stress, (MPa) | Normalized Bond Stress, (MPa) | Slip at Maximum Bond, (mm) | Failure Mode |
|---|---|---|---|---|---|---|---|
| A | A8L70CI | 1 | 31.25 | 17.76 | 17.76 | 0.24 | Rebar Rupture |
| 2 | 31.61 | 17.97 | 17.97 | 0.25 | Rebar Rupture | ||
| A8L90CI | 1 | 28.12 | 12.43 | 12.43 | 0.61 | Pull-out | |
| 2 | 33.5 | 14.81 | 14.81 | 0.19 | Rebar Rupture | ||
| A8L110CI | 1 | 32.26 | 11.67 | 11.67 | 0.17 | Rebar Rupture | |
| 2 | 33.01 | 11.94 | 11.94 | 0.19 | Rebar Rupture | ||
| A12L120CI | 1 | 78.76 | 17.41 | 17.41 | 0.53 | Splitting | |
| 2 | 77.99 | 17.24 | 17.24 | 0.65 | Splitting | ||
| A12L140CI | 1 | 79.01 | 14.97 | 14.97 | 0.27 | Splitting | |
| 2 | 79.12 | 14.99 | 14.99 | 0.24 | Rebar Rupture | ||
| A12L160CI | 1 | 83.36 | 13.82 | 13.82 | 0.18 | Rebar Rupture | |
| 2 | 78.47 | 13.01 | 13.01 | 0.26 | Splitting | ||
| A8L40PI | 1 | 30.25 | 30.09 | 30.09 | 0.1 | Rebar Rupture | |
| 2 | 31.5 | 31.33 | 31.33 | 0.09 | Rebar Rupture | ||
| A8L70PI | 1 | 31.12 | 17.69 | 17.69 | 0.08 | Rebar Rupture | |
| 2 | 30.24 | 17.19 | 17.19 | 0.06 | Rebar Rupture | ||
| A12L60PI | 1 | 82.13 | 36.31 | 36.31 | 0.42 | Rebar Rupture | |
| 2 | 82.18 | 36.33 | 36.33 | 0.33 | Rebar Rupture | ||
| A12L120PI | 1 | 80.98 | 17.9 | 17.9 | 0.13 | Rebar Rupture | |
| 2 | 77.63 | 17.16 | 17.16 | 0.12 | Rebar Rupture |
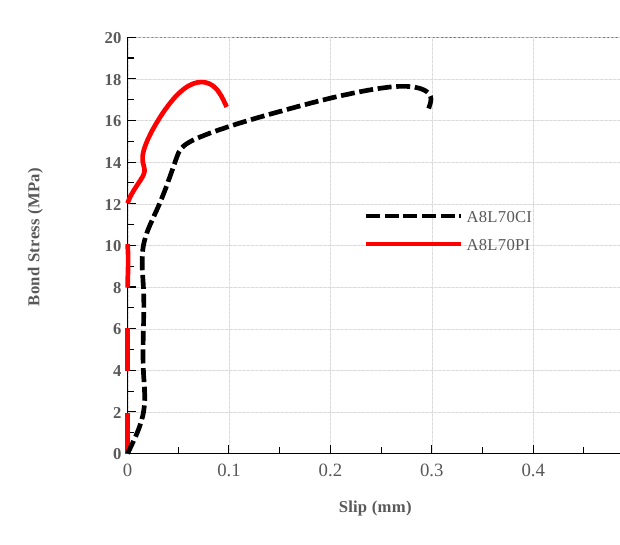
Fig. 12. Sample bond-slip behaviour of A series CI and PI specimens
The pull-out test results of the B-series
As the results show in Table 8, all specimens failed in rebar-rupture mode, except two CI specimens, which failed by pull-out. Like the case of the series A specimens, the slip in PI bars is significantly smaller than that of the CI bars. Even at an embedment depth of 5D (5 times the diameter of the PI bar), the PI specimens are failing due to rebar rupture, demonstrating highly efficient bond.
Table 8. The pull-out test results of the B-series
| Test Series | Specimen Name | Specimen No. | Maximum Load, kN | Maximum Bond Stress, MPa | Normalized Bond Stress, MPa | Slip at Maximum Bond, mm | Failure Mode | ||||||||
|---|---|---|---|---|---|---|---|---|---|---|---|---|---|---|---|
| B | B8L70CI | 1 | 31 | 17.62 | 14.32 | 0.16 | Rebar Rupture | ||||||||
| 2 | 30.24 | 17.19 | 13.98 | 0.16 | Rebar Rupture | ||||||||||
| B8L90CI | 1 | 32.26 | 14.26 | 11.59 | 0.17 | Rebar Rupture | |||||||||
| 2 | 31.87 | 14.09 | 11.46 | 0.1 | Rebar Rupture | ||||||||||
| B8L110CI | 1 | 31.74 | 11.48 | 9.34 | 0.12 | Rebar Rupture | |||||||||
| 2 | 32.62 | 11.8 | 9.59 | 0.84 | Pull-out | ||||||||||
| B12L120CI | 1 | 81.88 | 18.1 | 14.71 | 0.27 | Rebar Rupture | |||||||||
| 2 | 81.11 | 17.93 | 14.58 | 0.78 | Pull-out | ||||||||||
| B12L140CI | 1 | 79.12 | 14.99 | 12.19 | 0.18 | Rebar Rupture | |||||||||
| 2 | 79.38 | 15.04 | 12.23 | 0.18 | Rebar Rupture | ||||||||||
| B12L160CI | 1 | 76.12 | 12.62 | 10.26 | 0.39 | Rebar Rupture | |||||||||
| 2 | 76 | 12.6 | 10.24 | 0.36 | Rebar Rupture | ||||||||||
| B8L40PI | 1 | 31.12 | 30.96 | 25.17 | 0.06 | Rebar Rupture | |||||||||
| 2 | 30.25 | 30.09 | 24.46 | 0.12 | Rebar Rupture | ||||||||||
| B8L70PI | 1 | 34.01 | 19.33 | 15.71 | 0.09 | Rebar Rupture | |||||||||
| 2 | 34.2 | 19.44 | 15.81 | 0.03 | Rebar Rupture | ||||||||||
| B12L60PI | 1 | 79.12 | 34.98 | 28.44 | 0.28 | Rebar Rupture | |||||||||
| 2 | 74.62 | 32.99 | 26.82 | 0.43 | Rebar Rupture | ||||||||||
| B12L120PI | 1 | 79.89 | 17.66 | 14.35 | 0.04 | Rebar Rupture | |||||||||
| 2 | 79.89 | 17.66 | 14.35 | 0.18 | Rebar Rupture | ||||||||||
The pull-out test results of the C-series
The dominant mode of failure for C-series samples is rebar rupture (see Table 9). Most CI specimens with a 12 mm rebar diameter exhibited pull-out failure. Strain gauges were installed on C12L160CI and C12L160PI to observe the strain distribution. Fig. 14 shows the stress-strain behavior of the rebar on the selected specimens. The strain gauges were attached to the rebar at 30 mm from the beginning of the embedment length (see Fig. 15). The strain distribution shows, unlike the CI samples, that the bond stress in PI specimens is concentrated near the embedment length.
Table 9. The pull-out test results of the C-series
| Test Series | Specimen Name | Specimen No. | Maximum Load, kN | Maximum Bond Stress, MPa | Normalized Bond Stress, MPa | Slip at Maximum Bond, mm | Failure Mode | ||||||||
|---|---|---|---|---|---|---|---|---|---|---|---|---|---|---|---|
| C | C8L70CI | 1 | 31.05 | 17.65 | 15.27 | 0.47 | Pull-out | ||||||||
| 2 | 30.81 | 17.51 | 15.15 | 0.34 | Rebar Rupture | ||||||||||
| C8L90CI | 1 | 31.06 | 13.73 | 11.87 | 0.73 | Pull-out | |||||||||
| 2 | 31.31 | 13.84 | 11.97 | 0.48 | Rebar Rupture | ||||||||||
| C8L110CI | 1 | 31.57 | 11.42 | 9.87 | 0.14 | Rebar Rupture | |||||||||
| 2 | 47.27 | 17.1 | 14.79 | 0.13 | Rebar Rupture | ||||||||||
| C10L90CI | 1 | 47.84 | 16.92 | 14.63 | 0.27 | Rebar Rupture | |||||||||
| 2 | 46.34 | 16.39 | 14.17 | 0.35 | Pull-out | ||||||||||
| C10L110CI | 1 | 49.07 | 14.2 | 12.28 | 0.27 | Rebar Rupture | |||||||||
| 2 | 31.14 | 9.01 | 7.79 | 0.04 | Pull-out | ||||||||||
| C10L130CI | 1 | 49.83 | 12.2 | 10.55 | 0.05 | Rebar Rupture | |||||||||
| 2 | 49.83 | 12.2 | 10.55 | 0.03 | Rebar Rupture | ||||||||||
| C12L120CI | 1 | 71.88 | 15.89 | 13.38 | 0.1 | Pull-out | |||||||||
| 2 | 78.9 | 17.44 | 14.68 | 0.1 | Pull-out | ||||||||||
| C12L140CI | 1 | 76.63 | 14.52 | 12.22 | 0.99 | Pull-out | |||||||||
| 2 | 72.15 | 13.67 | 11.5 | 0.56 | Pull-out | ||||||||||
| C12L160CI | 1 | 67.86 | 11.25 | 9.47 | 0.6 | Pull-out | |||||||||
| 2 | 79.38 | 13.16 | 11.08 | 0.43 | Pull-out | ||||||||||
| C8L70PI | 1 | 30.81 | 17.51 | 15.14 | 0.02 | Rebar Rupture | |||||||||
| 2 | 35.57 | 20.22 | 17.49 | 0.03 | Rebar Rupture | ||||||||||
| C8L90PI | 1 | 31.31 | 13.84 | 11.97 | 0.01 | Rebar Rupture | |||||||||
| 2 | 32.3 | 14.28 | 12.35 | 0.01 | Rebar Rupture | ||||||||||
| C8L110PI | 1 | 33.87 | 12.25 | 10.6 | 0.11 | Rebar Rupture | |||||||||
| 2 | 32.07 | 11.6 | 10.03 | 0 | Rebar Rupture | ||||||||||
| C10L90PI | 1 | 47.59 | 16.83 | 14.55 | 0 | Rebar Rupture | |||||||||
| 2 | 43.6 | 15.42 | 13.33 | 0.01 | Rebar Rupture | ||||||||||
| C10L110PI | 1 | 48.35 | 13.99 | 12.1 | 0.06 | Rebar Rupture | |||||||||
| 2 | 48.59 | 14.06 | 12.16 | 0.07 | Rebar Rupture | ||||||||||
| C10L130PI | 1 | 47.17 | 11.55 | 9.99 | 0.21 | Rebar Rupture | |||||||||
| 2 | 49.34 | 12.08 | 10.45 | 0.02 | Rebar Rupture | ||||||||||
| C12L120PI | 1 | 77.9 | 17.22 | 14.49 | 0.03 | Rebar Rupture | |||||||||
| 2 | 80.39 | 17.77 | 14.96 | 0.02 | Rebar Rupture | ||||||||||
| C12L140PI | 1 | 74.89 | 14.19 | 11.95 | 0.01 | Rebar Rupture | |||||||||
| 2 | 78.38 | 14.85 | 12.5 | -0.01 | Rebar Rupture | ||||||||||
| C12L160PI | 1 | 81.73 | 13.55 | 11.4 | 0.02 | Rebar Rupture | |||||||||
| 2 | 71.42 | 11.84 | 9.97 | 0.02 | Rebar Rupture | ||||||||||
| CN | CN12L120CI | 1 | 70.75 | 15.64 | 13.11 | 1.05 | Pull-out | ||||||||
| 2 | 79.62 | 17.6 | 14.75 | 0.24 | Rebar Rupture | ||||||||||
| CN12L140CI | 1 | 78.01 | 14.78 | 12.38 | 0.76 | Pull-out after | |||||||||
| 2 | 74.52 | 14.12 | 11.83 | 0.38 | Pull-out | ||||||||||
| CN12L160CI | 1 | 77.99 | 12.93 | 10.84 | 0.55 | Rebar Rupture | |||||||||
| 2 | 78.47 | 13.01 | 10.9 | 0.64 | Pull-out | ||||||||||
| C8L40PI | 1 | 33.5 | 33.32 | 27.92 | 0.16 | Rebar Rupture | |||||||||
| 2 | 33.12 | 32.95 | 27.61 | 0.15 | Rebar Rupture | ||||||||||
| C10L50PI | 1 | 48.76 | 31.04 | 26.01 | 0.04 | Rebar Rupture | |||||||||
| 2 | 49.5 | 31.51 | 26.41 | 0.04 | Rebar Rupture | ||||||||||
| C12L60PI | 1 | 79.76 | 35.26 | 10.84 | 0.13 | Rebar Rupture | |||||||||
| 2 | 79.76 | 35.26 | 10.91 | 0.26 | Rebar Rupture | ||||||||||
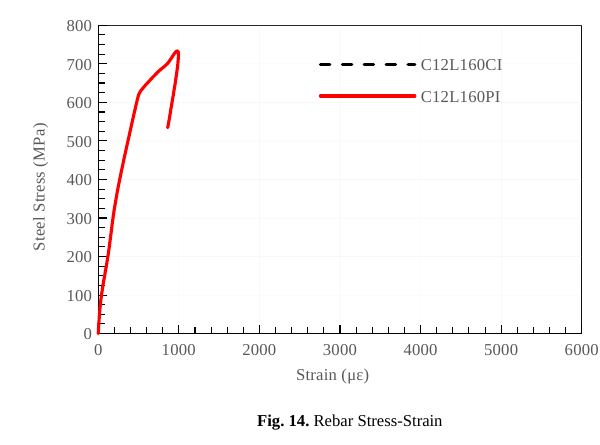
Fig. 14. Rebar Stress-Strain
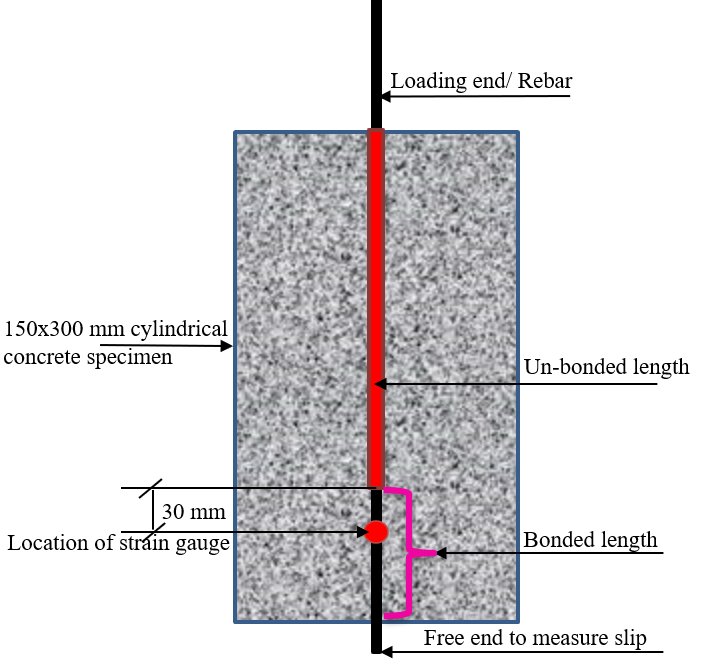
Fig. 15. Specimen detail and location of the strain gauge
The pull-out test results of the D-series
Almost all of the CI and PI samples, except one (D12L120CI), failed due to rebar rupture. Additionally, the effect of post-drilling hardened concrete has been investigated through four specimens. Two of which had a plastic sleeve (D12L120PI) at the center of the cylinders for ease of drilling, and the other two (D12L120PD-PI) specimens were drilled after the concrete had hardened. The result shows (Fig. 16) that the drilling technique has no effect on the bond performance and failure mode of the samples. Details of the experimental results for the D-series are shown in Table 10.
Table 10. The pull-out test results of the D-series
| Test Series | Specimen Name | Specimen No. | Maximum Load, kN | Maximum Bond Stress, MPa | Normalized Bond Stress, MPa | Slip at Maximum Bond, mm | Failure Mode |
|---|---|---|---|---|---|---|---|
| D | D8L70CI | 1 | 31.49 | 17.9 | 12.99 | 0.07 | Rebar Rupture |
| 2 | 31.76 | 18.05 | 13.09 | 0.06 | Rebar Rupture | ||
| D8L90CI | 1 | 33 | 14.59 | 10.58 | 0.04 | Rebar Rupture | |
| 2 | 31.12 | 13.76 | 9.98 | 0.04 | Rebar Rupture | ||
| D8L110CI | 1 | 32.62 | 11.8 | 8.56 | 0.2 | Rebar Rupture | |
| 2 | 32.51 | 11.76 | 8.53 | 0.03 | Rebar Rupture | ||
| D12L120CI | 1 | 65.37 | 14.45 | 10.48 | 1.39 | Pull-out | |
| 2 | 84.23 | 18.62 | 13.51 | 0.33 | Rebar Rupture | ||
| D12L140CI | 1 | 79.27 | 15.02 | 10.89 | 0.28 | Rebar Rupture | |
| 2 | 83.23 | 15.77 | 11.44 | 0.12 | Rebar Rupture | ||
| D12L160CI | 1 | 81.97 | 13.59 | 9.86 | 0.16 | Rebar Rupture | |
| 2 | 95.12 | 15.77 | 11.44 | 0.16 | Rebar Rupture | ||
| D8L40PI | 1 | 33.88 | 33.7 | 24.44 | 0.11 | Rebar Rupture | |
| 2 | 31 | 30.84 | 22.37 | 0.05 | Rebar Rupture | ||
| D8L70PI | 1 | 32 | 18.19 | 13.19 | 0.05 | Rebar Rupture | |
| 2 | 30.75 | 17.48 | 12.68 | 0.07 | Rebar Rupture | ||
| D12L60PI | 1 | 81.38 | 35.98 | 26.1 | 0.11 | Rebar Rupture | |
| 2 | 77.99 | 34.48 | 25.01 | 0.06 | Rebar Rupture | ||
| D12L120PI | 1 | 77.99 | 17.24 | 12.51 | 0.03 | Rebar Rupture | |
| 2 | 79.76 | 17.63 | 12.79 | 0.05 | Rebar Rupture | ||
| D12L120PI | 3 | 76.63 | 16.94 | 12.28 | 0 | Rebar Rupture | |
| 4 | 74.24 | 16.41 | 11.9 | 0.01 | Rebar Rupture | ||
| D12L120PDPI* | 1 | 73.38 | 16.22 | 16.22 | 0.01 | Rebar Rupture | |
| 2 | 75.01 | 16.58 | 16.59 | 0.01 | Rebar Rupture |
* Specimens without a pre-installed plastic sleeve and post- drilled on hardened concrete.
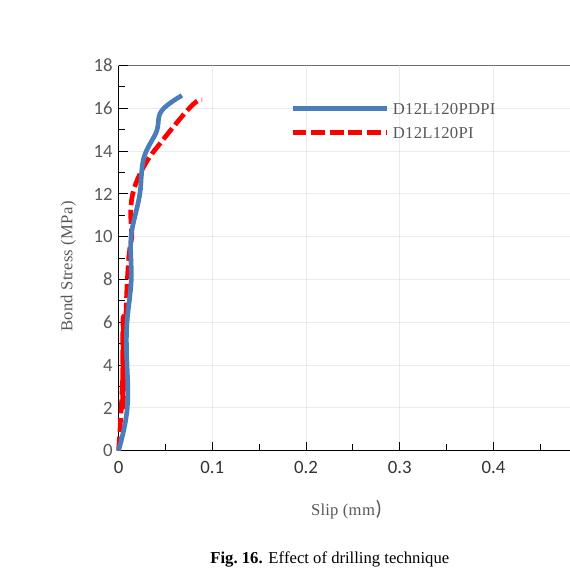
Fig. 16. Effect of drilling technique
Aggregate size effect
To investigate the role of aggregate size, the results of the CI specimens were therefore compared, as presented in Fig. 17. Since rebar rupture is not a useful failure mode for evaluating aggregate-size influence, only the CI specimens with identical embedment length (120 mm) and bar diameter (12 mm) that failed by splitting or pull-out were considered in the analysis. The results indicate that aggregate size does not have a significant effect on the ultimate bond strength of CI specimens. Unlike the findings in [5] and [6], a larger aggregate size tends to have lower bond strength. However, a trend in slip behavior was observed: slip generally decreases with increasing aggregate size. This suggests that larger aggregates may enhance the stiffness of the interfacial zone between concrete and reinforcement. The residual bond stress was also higher in specimens made with larger aggregate sizes, indicating improved post-peak bond capacity.
A more pronounced aggregate-size influence would be expected with larger bar diameters, since larger bars have deeper and wider ribs capable of generating higher radial pressures on the surrounding concrete. Increased radial pressure promotes splitting, and larger aggregates typically provide greater resistance to tensile splitting stresses, as supported by the values presented in Table 11.
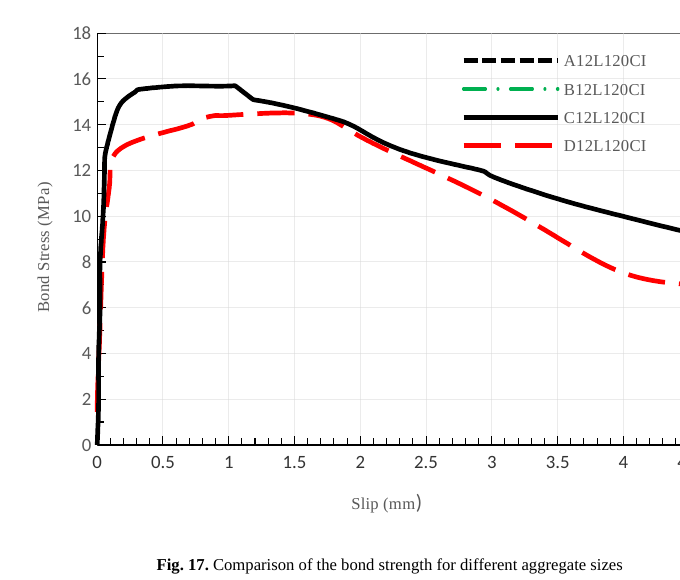
Fig. 17. Comparison of the bond strength for different aggregate sizes
Comparison of experimental results, code provisions and numerical models
Comparison of experimental bond strength results and prediction equations is shown in Table 11. The comparison is made for CI specimens since the code provisions and numerical models are developed for the bond strength of CI reinforcement bars in concrete. Additionally, the comparison results are shown in Fig. 18.
Table 11. Comparison of experimental and analytical average normalised bond strength
| Test Series | Specimen | Normalized Average Bond Strength (MPa) | |||||||||||||
|---|---|---|---|---|---|---|---|---|---|---|---|---|---|---|---|
| Experimental | CEB-FIP 2010 | ACI 318 | CSA | AS 3600 | NZS 3101: 2006 | JSCE 2007 | IS 456 | ES-EN 2015 and EC 1992 | Shima 1987 | Zuo and Darwin 2000 | Esfahani and Rangan 1998 | Orangun et al. 1997 | Darwin et al. 1996b | ||
| A | A8L70CI | 17.87 | 12.54 | 1.94 | 2.43 | 9.69 | 2.78 | 1.86 | 1.92 | 1.26 | 7.73 | 10.25 | 11.43 | 8.95 | 7.01 |
| A8L90CI | 13.62 | 12.54 | 1.94 | 2.43 | 9.69 | 2.78 | 1.86 | 1.92 | 1.26 | 7.73 | 10.25 | 11.43 | 8.95 | 7.01 | |
| A8L110CI | 11.81 | 12.54 | 1.94 | 2.43 | 9.69 | 2.78 | 1.86 | 1.92 | 1.26 | 7.73 | 10.25 | 11.43 | 8.95 | 7.01 | |
| A12L120CI | 17.33 | 12.54 | 1.94 | 2.43 | 6.63 | 2.78 | 1.86 | 1.92 | 1.26 | 7.72 | 6.67 | 9.73 | 5.92 | 4.58 | |
| A12L140CI | 14.98 | 12.54 | 1.94 | 2.43 | 6.63 | 2.78 | 1.86 | 1.92 | 1.26 | 7.72 | 6.67 | 9.73 | 5.92 | 4.58 | |
| A12L160CI | 13.42 | 12.54 | 1.94 | 2.43 | 6.63 | 2.78 | 1.86 | 1.92 | 1.26 | 7.72 | 6.67 | 9.73 | 5.92 | 4.58 | |
| B | B8L70CI | 17.41 | 11.84 | 1.94 | 2.43 | 7.88 | 2.78 | 2 | 1.82 | 0.97 | 7.67 | 9.5 | 11.43 | 8.95 | 6.48 |
| B8L90CI | 14.18 | 11.84 | 1.94 | 2.43 | 7.88 | 2.78 | 2 | 1.82 | 0.97 | 7.67 | 9.5 | 11.43 | 8.95 | 6.48 | |
| B8L110CI | 11.64 | 11.84 | 1.94 | 2.43 | 7.88 | 2.78 | 2 | 1.82 | 0.97 | 7.67 | 9.5 | 11.43 | 8.95 | 6.48 | |
| B12L120CI | 18.02 | 11.84 | 1.94 | 2.43 | 5.39 | 2.78 | 2 | 1.82 | 0.97 | 7.67 | 6.17 | 9.73 | 5.92 | 4.21 | |
| B12L140CI | 15.02 | 11.84 | 1.94 | 2.43 | 5.39 | 2.78 | 2 | 1.82 | 0.97 | 7.67 | 6.17 | 9.73 | 5.92 | 4.21 | |
| B12L160CI | 12.61 | 11.84 | 1.94 | 2.43 | 5.39 | 2.78 | 2 | 1.82 | 0.97 | 7.67 | 6.17 | 9.73 | 5.92 | 4.21 | |
| C | C8L70CI | 17.58 | 12.03 | 1.94 | 2.43 | 8.38 | 2.78 | 1.95 | 1.8 | 1.14 | 7.67 | 9.72 | 11.43 | 8.95 | 6.63 |
| C8L90CI | 13.79 | 12.03 | 1.94 | 2.43 | 8.38 | 2.78 | 1.95 | 1.8 | 1.14 | 7.67 | 9.72 | 11.43 | 8.95 | 6.63 | |
| C8L110CI | 14.26 | 12.03 | 1.94 | 2.43 | 8.38 | 2.78 | 1.95 | 1.8 | 1.14 | 7.67 | 9.72 | 11.43 | 8.95 | 6.63 | |
| C10L90CI | 16.66 | 12.03 | 1.94 | 2.43 | 6.79 | 2.78 | 1.95 | 1.8 | 1.14 | 7.67 | 7.8 | 10.51 | 7.15 | 5.32 | |
| C10L110CI | 11.61 | 12.03 | 1.94 | 2.43 | 6.79 | 2.78 | 1.95 | 1.8 | 1.14 | 7.67 | 7.8 | 10.51 | 7.15 | 5.32 | |
| C10L130CI | 12.2 | 12.03 | 1.94 | 2.43 | 6.79 | 2.78 | 1.95 | 1.8 | 1.14 | 7.67 | 7.8 | 10.51 | 7.15 | 5.32 | |
| C12L120CI | 16.67 | 11.94 | 1.94 | 2.43 | 5.58 | 2.7 | 1.9 | 1.89 | 1.68 | 7.67 | 6.25 | 9.73 | 5.92 | 4.27 | |
| C12L140CI | 14.1 | 11.94 | 1.94 | 2.43 | 5.58 | 2.7 | 1.9 | 1.89 | 1.68 | 7.67 | 6.25 | 9.73 | 5.92 | 4.27 | |
| C12L160CI | 12.21 | 11.94 | 1.94 | 2.43 | 5.58 | 2.7 | 1.9 | 1.89 | 1.68 | 7.67 | 6.25 | 9.73 | 5.92 | 4.27 | |
| CN | CN12L120CI | 16.62 | 11.93 | 1.94 | 2.43 | 5.55 | 2.78 | 1.98 | 1.88 | 1.03 | 7.67 | 6.24 | 9.73 | 5.92 | 4.26 |
| CN12L140CI | 14.45 | 11.93 | 1.94 | 2.43 | 5.55 | 2.78 | 1.98 | 1.88 | 1.03 | 7.67 | 6.24 | 9.73 | 5.92 | 4.26 | |
| CN12L160CI | 12.97 | 11.93 | 1.94 | 2.43 | 5.55 | 2.78 | 1.98 | 1.88 | 1.03 | 7.67 | 6.24 | 9.73 | 5.92 | 4.26 | |
| D | D8L70CI | 17.98 | 11.55 | 1.94 | 2.43 | 9.26 | 2.63 | 2.07 | 1.74 | 1.15 | 7.71 | 12.17 | 12.52 | 11.96 | 6.21 |
| D8L90CI | 14.18 | 11.55 | 1.94 | 2.43 | 9.26 | 2.63 | 2.07 | 1.74 | 1.15 | 7.71 | 12.17 | 12.52 | 11.96 | 6.21 | |
| D8L110CI | 11.78 | 11.55 | 1.94 | 2.43 | 9.26 | 2.63 | 2.07 | 1.74 | 1.15 | 7.71 | 12.17 | 12.52 | 11.96 | 6.21 | |
| D12L120CI | 16.54 | 11.55 | 1.94 | 2.43 | 6.29 | 2.78 | 2.07 | 1.74 | 1.15 | 7.71 | 7.88 | 11.68 | 7.91 | 4.03 | |
| D12L140CI | 15.4 | 11.55 | 1.94 | 2.43 | 6.29 | 2.78 | 2.07 | 1.74 | 1.15 | 7.71 | 7.88 | 11.68 | 7.91 | 4.03 | |
| D12L160CI | 14.68 | 11.55 | 1.94 | 2.43 | 6.29 | 2.78 | 2.07 | 1.74 | 1.15 | 7.71 | 7.88 | 11.68 | 7.91 | 4.03 | |
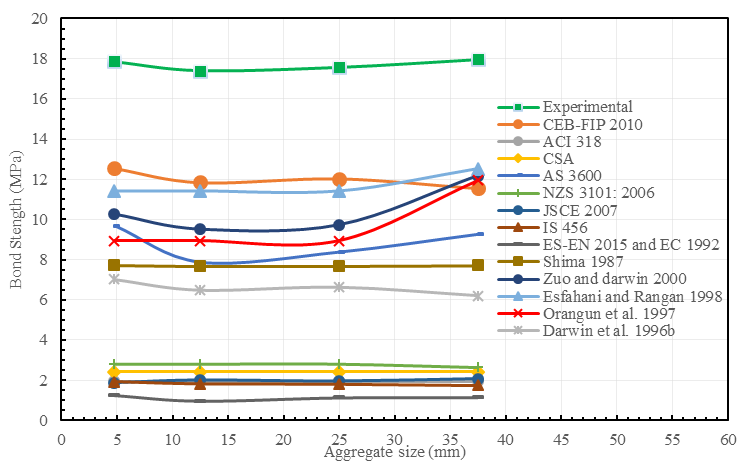
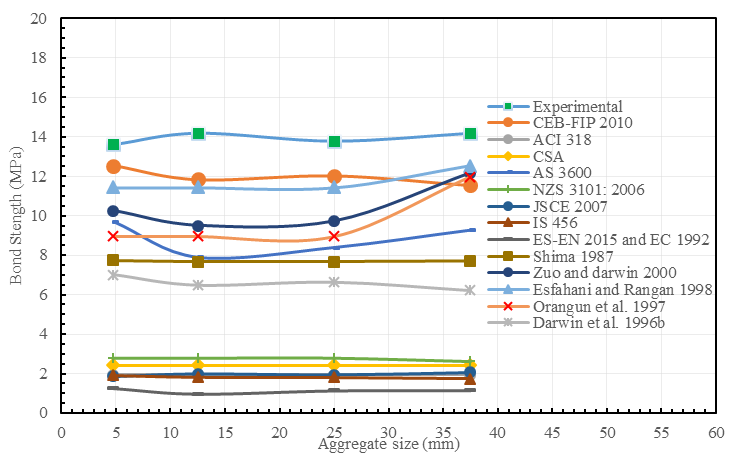
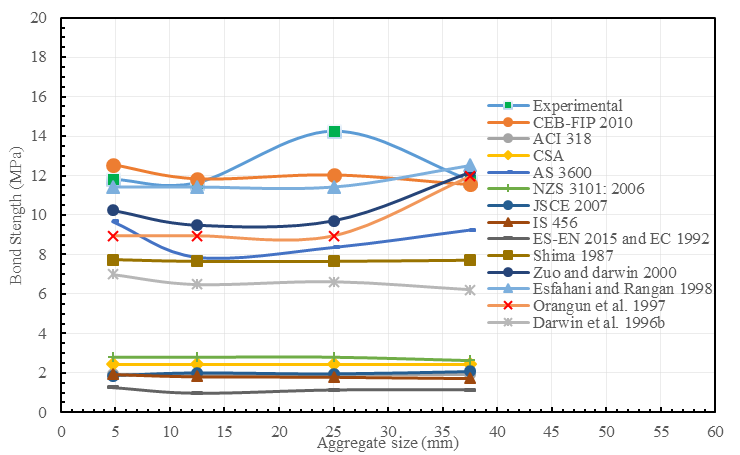
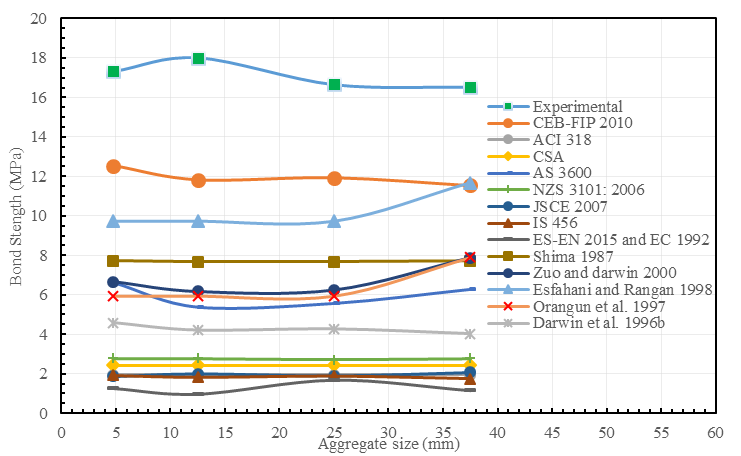
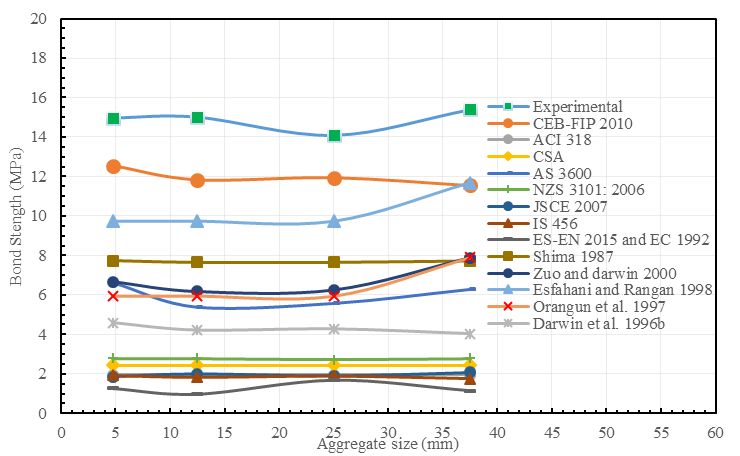
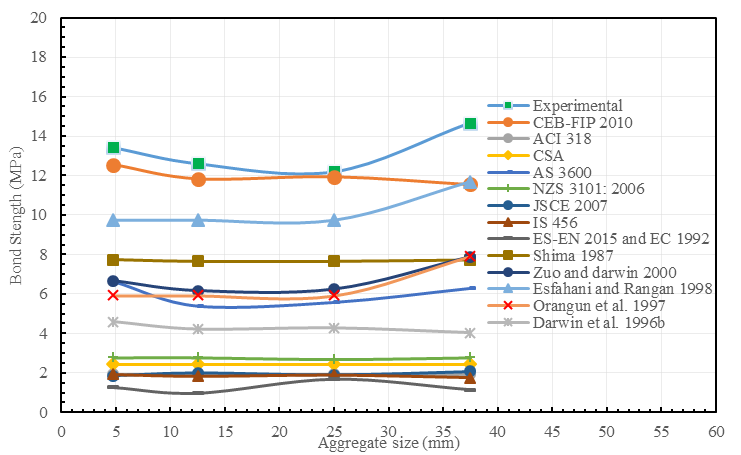
Fig. 18. Comparison of experimental and analytical average normalized bond strength; a) d b = 8 mm and l b = 70 mm, b) d b = 8 mm and l b = 90 mm, c) d b = 8 mm and l b = 110 mm, d) d b = 12 mm and l b = 120 mm, e) d b = 12 mm and l b = 140 mm, f) d b = 12 mm and l b = 160 mm
The comparison results are shown in Table 11 and Fig. 18 indicates that the code predictions are more conservative than the prediction models proposed by different researchers, as they are meant for design. EC 2 [16] and ESEN 1992; 2015 [17] the perdition equation is found to be the most conservative one. In contrast to the available analytical models, the CEB-FIP 2010 model code [1] estimation is in good agreement with the experimental results compared to other models.
Conclusion
This study evaluated bond performance between PI and CI bar specimens. The following quantitative conclusions are drawn:
Failure Modes & Ductility: 100% of PI specimens exhibited rebar rupture, regardless of aggregate sizes (4.75 mm, 9 mm, 12.5 mm, 25 mm, 37.5 mm), even with embedment lengths reduced by 43% compared to CI counterparts. PI bars demonstrated a 60ŌĆō68% reduction in slip relative to CI bars, confirming the superior interfacial stiffness of the epoxy mortar.
The influence of aggregate size on the bond strength of CI specimens with smaller bar diameters (8 mm and 12 mm) resulted in negligible fluctuations of less than 10%. However, increasing aggregate size from 4.75 mm to 25 mm led to an increase in residual bond capacity by 56%.
The experimental results were further compared with the predictions of available analytical bond models. Amongst these, the CEB-FIP 2010 model provided the most accurate prediction for CI specimens with a predicted/experimental (P/E) ratio of 0.85ŌłÆ0.95, R2 of 0.84 and MSE of 2.14, whereas other analytical models under-predicted strength by an average of 77%, indicating that the underlying assumptions in CEB-FIP 2010 regarding bond mechanism remain valid.
Future Directions and Limitations
The current study was limited to smaller bar diameters (8mm, 10mm, and 12mm). It is recommended in the future to investigate the effect of aggregate size on the bond strength of larger bar diameters. In addition, the scale of the study shall be increased to include structural elements such as beam-column joints.
CRediT author statement
Sadik Umer:┬ĀConceptualization, Methodology, Writing-Original draft preparation; Esayas Fitwi:┬ĀConceptualization, Methodology, Supervision - Reviewing and Editing.
References
- fib Special Activity Group 5, fib Model Code for Concrete Structures 2010. Berlin, Germany: Ernst & Sohn, 2013. doi: 10.1002/9783433604090.
- ACI Committee 408, Bond and development of straight reinforcing bars in tension, American Concrete Institute, Farmington Hills, MI, USA, Tech. Rep. ACI 408R-03, Sep. 2003.
- K. Pandurangan, A. Dayanithy, and S. O. Prakash, ōInfluence of treatment methods on the bond strength of recycled aggregate concreteö, Construction and Building Materials, vol. 120, pp. 212¢221, May 2016. doi: 10.1016/j.conbuildmat.2016.05.093.
- P. R. Shunmuga Vembu and A. K. Ammasi, A comprehensive review on the factors affecting bond strength in concrete, Buildings, vol. 13, no. 3, Mar. 2023, Art. no. 577. doi: 10.3390/buildings13030577.
- S. Iqbal, N. Ullah, and A. Ali, Effect of maximum aggregate size on the bond strength of reinforcements in concrete, Engineering Technology & Applied Science Research, vol. 8, no. 3, pp. 2892¢2896, Jun. 2018. doi: 10.48084/etasr.1989.
- A. Lemlem and G. Y. Esayas, Role of coarse aggregate sizes in evaluating the bond-slip mechanism of reinforced concrete, Construction and Building Materials, vol. 458, 2025, Art. no. 139712. doi: 10.1016/j.conbuildmat.2024.139712.
- B. S. Hamad, R. A. Hammoud, and J. Kunz, Evaluation of bond strength of Bonded-In or Post-Installed reinforcement, ACI Structural Journal, vol. 103, no. 2, 2006. doi: 10.14359/15178.
- Ridwan, Reinforced concrete beam-column joints strengthened in shear with embedded bars, Ph.D. dissertation, Univ. Birmingham, UK, 2016. Available here.
- J. I. Croppi et al., Bond stresses in post-installed reinforcing bars derived via fiber optic sensors, Structural Concrete, vol. 25, no. 3, pp. 1884¢1899, 2024. doi: 10.1002/suco.202300877.
- D. Darwin and S. S. Zavaregh, Bond strength of grouted reinforcing bars, ACI Structural Journal, vol. 93, no. 4, 1996. doi: 10.14359/9707.
- Design of Concrete Structures, CSA Group Standard CAN3-A23.3, 2004.
- Concrete Structures, Standards Australia AS 3600-1994, 1994.
- D. Borosnyoi-Crawley, Development and splice length of reinforcement in NZS 3101:2006, SSRN, 2023. doi: 10.2139/ssrn.453107.
- T. Uomoto et al., Standard specifications for concrete structures-2007, Concrete Journal, vol. 46, no. 7, pp. 3¢14, 2008. doi: 10.3151/coj1975.46.7_3.
- Plain and Reinforced Concrete Ś Code of Practice, IS 456:2000.
- Eurocode 2: Design of Concrete Structures, EN 1992-1-1, 2004.
- Design of Concrete Structures, ES EN 1992-1-1:2015, Ethiopia, 2015.
- ACI Committee 355, Qualification of Post-Installed Mechanical Anchors in Concrete, ACI 355.2-19, 2019.
- EOTA, Systems for post-installed rebar connections with mortar, EAD 330087-01-0601, 2020. www.eota.eu.
- H. Shima, L. Chou, and H. Okamura, Micro and macro models for bond in reinforced concrete, J. Fac. Eng. Univ. Tokyo, vol. 39, 1987.
- J. Zuo and D. Darwin, Splice strength..., ACI Structural Journal, 2000. doi: 10.14359/7428.
- M. R. Esfahani and B. Rangan, Bond between Normal Strength and High-Strength Concrete, ACI Structural Journal, 1998. doi: 10.14359/545.
- C. O. Orangun et al., The strength of anchor bars, ACI Structural Journal, 1975. Link.
- D. Darwin et al., Development length criteria, ACI Structural Journal, 1992. doi: 10.14359/4158.
- ASTM C136-06, Sieve Analysis of Aggregates, ASTM, 2014.
- ASTM C33-01, Concrete Aggregates, ASTM, 2001.
- ASTM C125, Terminology Relating to Concrete, ASTM, 2021.
- ACI 318-19, Building Code Requirements for Structural Concrete, 2019.
- ACI 211.1-91, Concrete Mix Design, 1991.
- ASTM C192/C192M-02, Concrete Specimen Preparation, 2002.
- B. A. Tayeh et al., Pull-out behavior of post installed rebar, J. King Saud Univ., 2019. doi: 10.1016/j.jksues.2017.11.005.
- K. S. Ahmed et al., Bond strength of post-installed rebar, Case Studies in Construction Materials, 2021. doi: 10.1016/j.cscm.2021.e00581.
Received: September 12, 2025
Accepted: December 21, 2025